
Info Views
Cities: Skylines II features 33 different Info Views displaying and highlighting various information about the city, accessible by clicking on the Info icon in the top-left corner.
Info view icon

Associated Info Views will also be automatically opened when a relevant construction menu is opened.
The info views panel

Icons
Roads
Panel shows total parking facility availability.
Map highlights parking lots & buildings, maintenance depots, and road maintenance vehicles. Roads will be shown in green-red showing their current condition.
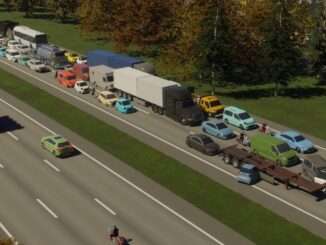
Traffic
Panel shows a graph with the traffic flow throughout the day, indicating how well the current road network serves the needs of traffic.
A higher percentage indicates better traffic flow.
Map highlights traffic flow and can be changed to highlight traffic volume instead.
Electricity
Panel shows total electricity availability, any current electricity trade, as well as total battery charge.
Map highlights power plants, transformers and batteries. The electricity grid is shown in green-red showing current consumption, and bottlenecks will be highlighted. The terrain can optionally show wind speed and direction, groundwater deposits, and surface water flow.
Water & Sewage
Panel shows total water and sewage availability, any current water trade, as well as any current sewage export.
Map highlights water and sewage facilities. The water and sewage grids will be shown. On water pipes pure water will display blue and polluted water will display brown. Groundwater deposits, surface water flow and the pollution in both will be shown as well.
Healthcare & Deathcare
Panel shows total healthcare, crematorium and cemetery availability.
Map highlights healthcare buildings, deathcare buildings, ambulances and hearses. Roads will be shown in green-red showing current healthcare coverage.
Garbage Management
Panel shows total garbage processing status and landfill availability.
Map highlights garbage facilities and trucks. Buildings will be shown in green-red showing current garbage accumulation.
Fire & Rescue
Panel shows average fire hazard.
Map highlights fire & rescue buildings, firewatch towers and their range and fire engines. Roads will be shown in green-red showing current fire & rescue coverage. Buildings and trees will be shown in green-red showing current fire hazard.
Disaster Control
Panel shows total shelter availability.
Map highlights disaster prevention facilities, emergency shelters, evacuation buses and destroyed buildings. Roads will be shown in green-red showing current emergency shelter coverage. Buildings will be shown in white-red showing current damage.
Police
Panel shows total jail and prison availability and average crime probability.
Map highlights police buildings, prisons, police cars and prison vans. Roads will be shown in green-red showing current police coverage. Buildings will be shown in green-red showing current crime probability.
Administration
Map highlights administrative buildings and welfare offices.
Roads will be shown in green-red showing current welfare coverage. Buildings will be shown in green-red showing current citizen well-being.
Education
Panel shows total capacity for elementary schools, high schools, colleges and universities, as well as a chart showing the percentages of population at each education level.
Map highlights schools and research facilities. Roads will be shown in green-red showing current education coverage. Buildings will be shown in green-red showing current citizen education.
Transportation
Panel shows the number of lines, tourists and citizens for each type of public transport as well as put together.
It also shown the number of routes and cargo weight for each type of cargo transport as well as put together.
Map highlights the entire transportation system.
Post
Panels shows total mail service availability.
Map highlights post facilities, post vehicles and mailboxes. Roads will be shown in green-red showing current post service coverage. Buildings will be shown in green-red showing current mail accumulation.
Telecom
Map highlights telecom facilities. Buildings will be shown in green-red showing current network quality.
Terrain will be shown in green-white showing current telecom coverage.
Leisure
Map highlights parks and attractions, park maintenance buildings, park maintenance vehicles and leisure activities.
Roads will be shown in green-red showing current park coverage.
Tourism
Panel shows total city attractiveness.
Map highlights hotels, tourists and parks and attractions. Terrain will be shown in green-blue showing current attractiveness.
Outside Connections
Panel shows a chart with imports and exports.
Map shows an icon above each outside connection.
Residential
Map highlights residential buildings in matching color and residential signature buildings in pink.
Roads will be shown in green-red showing current residential suitability. The terrain can optionally show current ground pollution in green-red.
Commercial
Map highlights commercial buildings in matching color and commercial signature buildings in pink.
Roads will be shown in green-red showing current commercial suitability. Terrain will be shown in green-white showing current customers.
Industrial
Map highlights industrial buildings in matching color and industrial signature buildings in pink.
Roads will be shown in green-red showing current industrial suitability. The terrain can optionally show groundwater deposits and wind speed and direction.
Office
Map highlights office buildings in matching color and office signature buildings in pink.
Roads will be shown in green-red showing current office suitability.
Building Level
Panel shows a chart for each zone type showing percentages of buildings at each level.
Buildings will be shown in green-red showing their current level.
Land Value
Panel shows average land value.
Buildings will be shown in green-red showing their current land value. Terrain will be shown in blue-white showing current land value.
Company Profitability
Panel shows the average profit for commercial, industrial and office companies.
Buildings will be shown in green-red showing their current profitability.
Natural Resources
Panel shows for each resource the total availability and utilization rate.
For Fertile Land and Wood it also shows the renewal rate.
Map highlights specialized industry hubs and areas. Terrain will show all natural resources: Land Fertility in yellow, Wood in green, Ore in blue and Oil in black.
Population
Panel shows various population statistics and a chart showing the percentages of population at each age.
Buildings will be shown in green-red showing their current citizen age. Terrain will be shown in blue-white showing current population density.
Happiness
Panel shows all factors positively or negatively influencing happiness.
Map highlights parts & attractions. Roads will be shown in green-red showing current healthcare coverage. Buildings will be shown in green-gray showing current citizen happiness.
Citizen Wealth
Buildings will be shown in green-red showing current citizen wealth.
Workplace Availability
Panel shows a chart showing the number of jobs for each education level as well as their total.
Terrain will be shown in green-black showing available workplaces.
Air Pollution
Panel shows average air pollution.
Terrain will be shown in blue-red showing current air pollution. Buildings and roads will be shown in white-orange showing their generated air pollution. The terrain will also indicate wind speed and direction with arrows.
Ground Pollution
Panel shows average ground pollution.
Terrain will be shown in blue-red showing current ground pollution. Buildings will be shown in white-orange showing their generated ground pollution.
Noise Pollution
Panel shows average noise pollution.
Terrain will be shown in blue-red showing current noise pollution. Buildings and roads will be shown in white-orange showing their generated noise pollution.
Water Pollution
Panel shows average water pollution.
Terrain will be shown in green-black showing current water pollution. Buildings will be shown in white-orange showing their generated water pollution. The terrain will also indicate surface water speed and flow direction arrows.

Be the first to comment