
The in-game part ranking chart does not accurately reflect actual 3D Mark performance. Some graphics cards appear to perform better in the in-game chart than their 3D Mark scores indicate. Here are some charts with more precise performance data.
Part Ranking – Graphics Cards
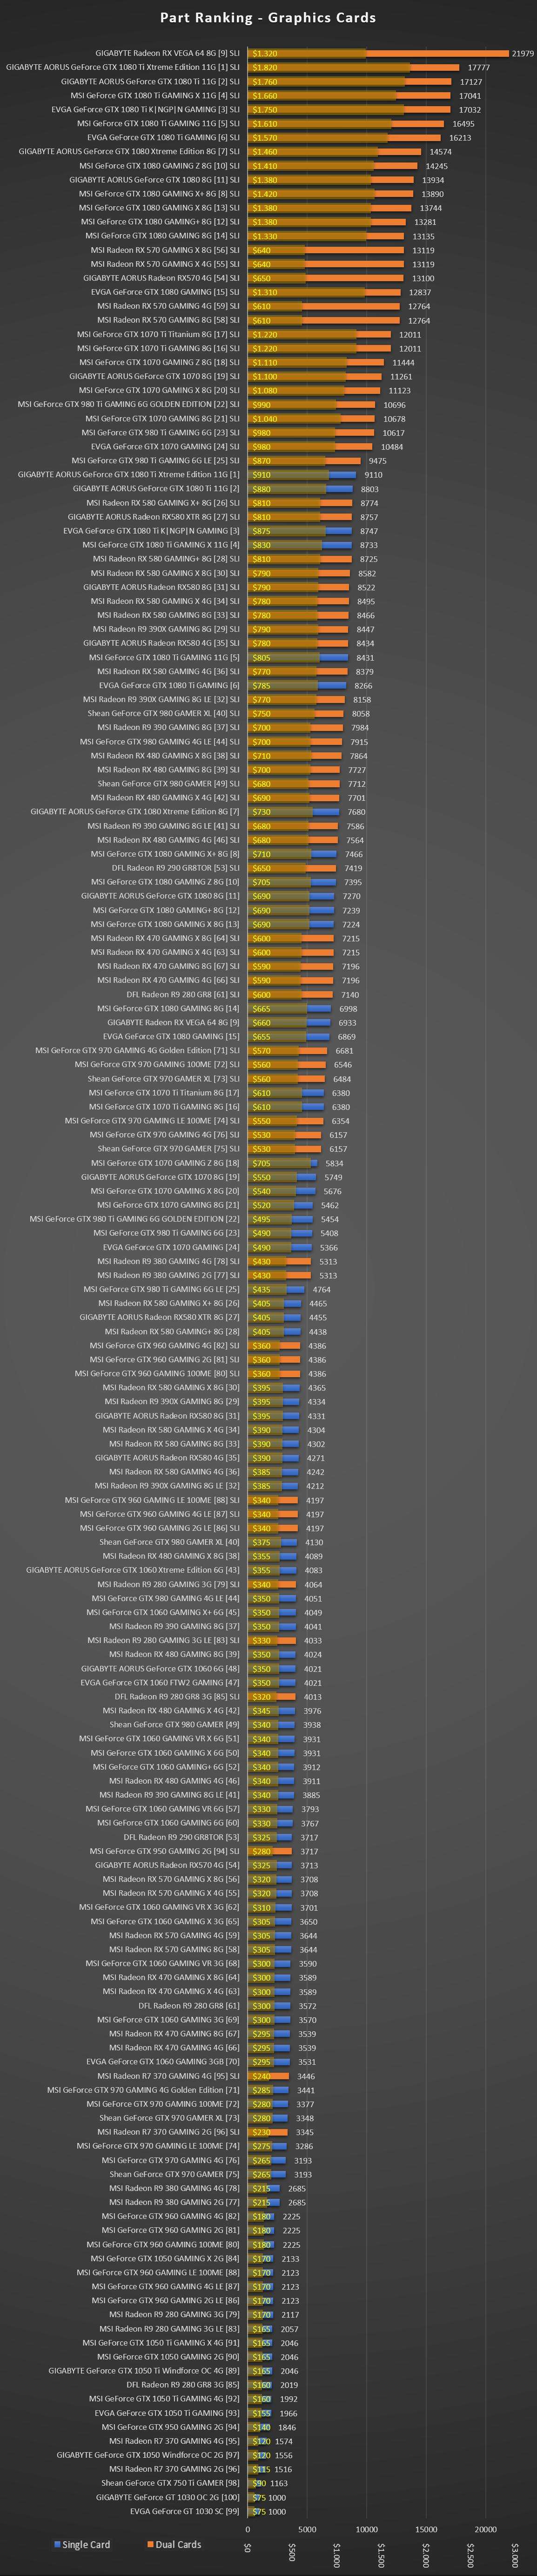
- This is the Part Ranking chart for SLI/CrossFire cards alongside single cards.
- The chart here is rearranged according to actual performance numbers.
- SLI/CrossFire configurations and costs are marked for ease of use.
The SLI notation denotes 2 cards of the same type in SLI or CrossFire configuration.
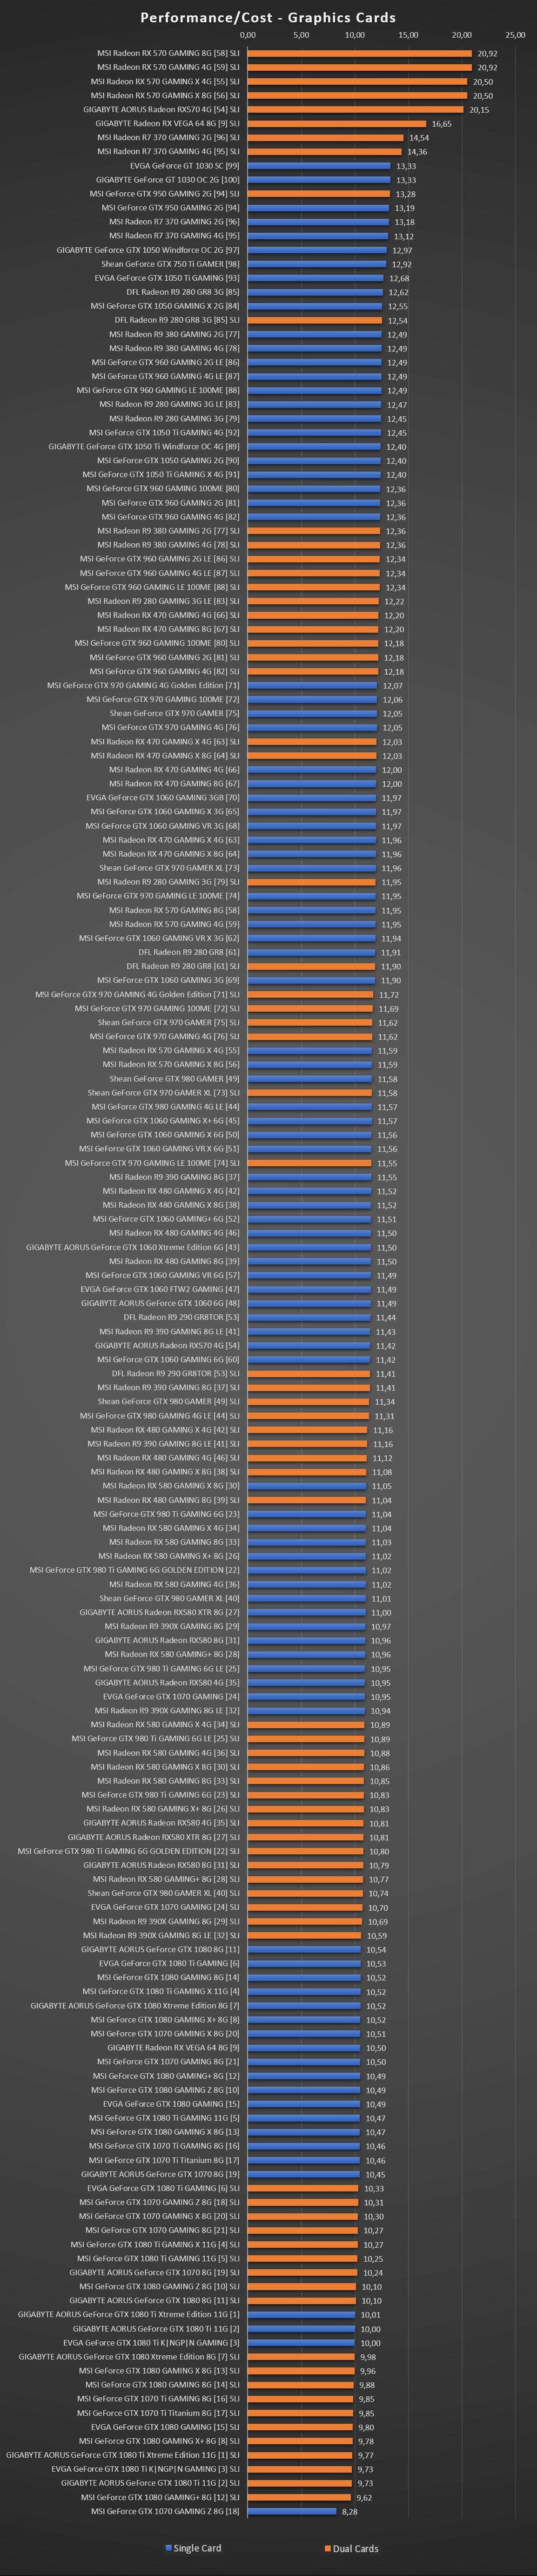
Performance / Cost – Graphics Cards
- This is the Performance/Cost chart for all GPU configurations.
- The chart here is rearranged according to actual performance numbers.
- SLI/CrossFire configurations are marked for ease of use.
- The higher the value, the better cost-benefit you’re getting!
The SLI notation denotes 2 cards of the same type in SLI or CrossFire configuration.
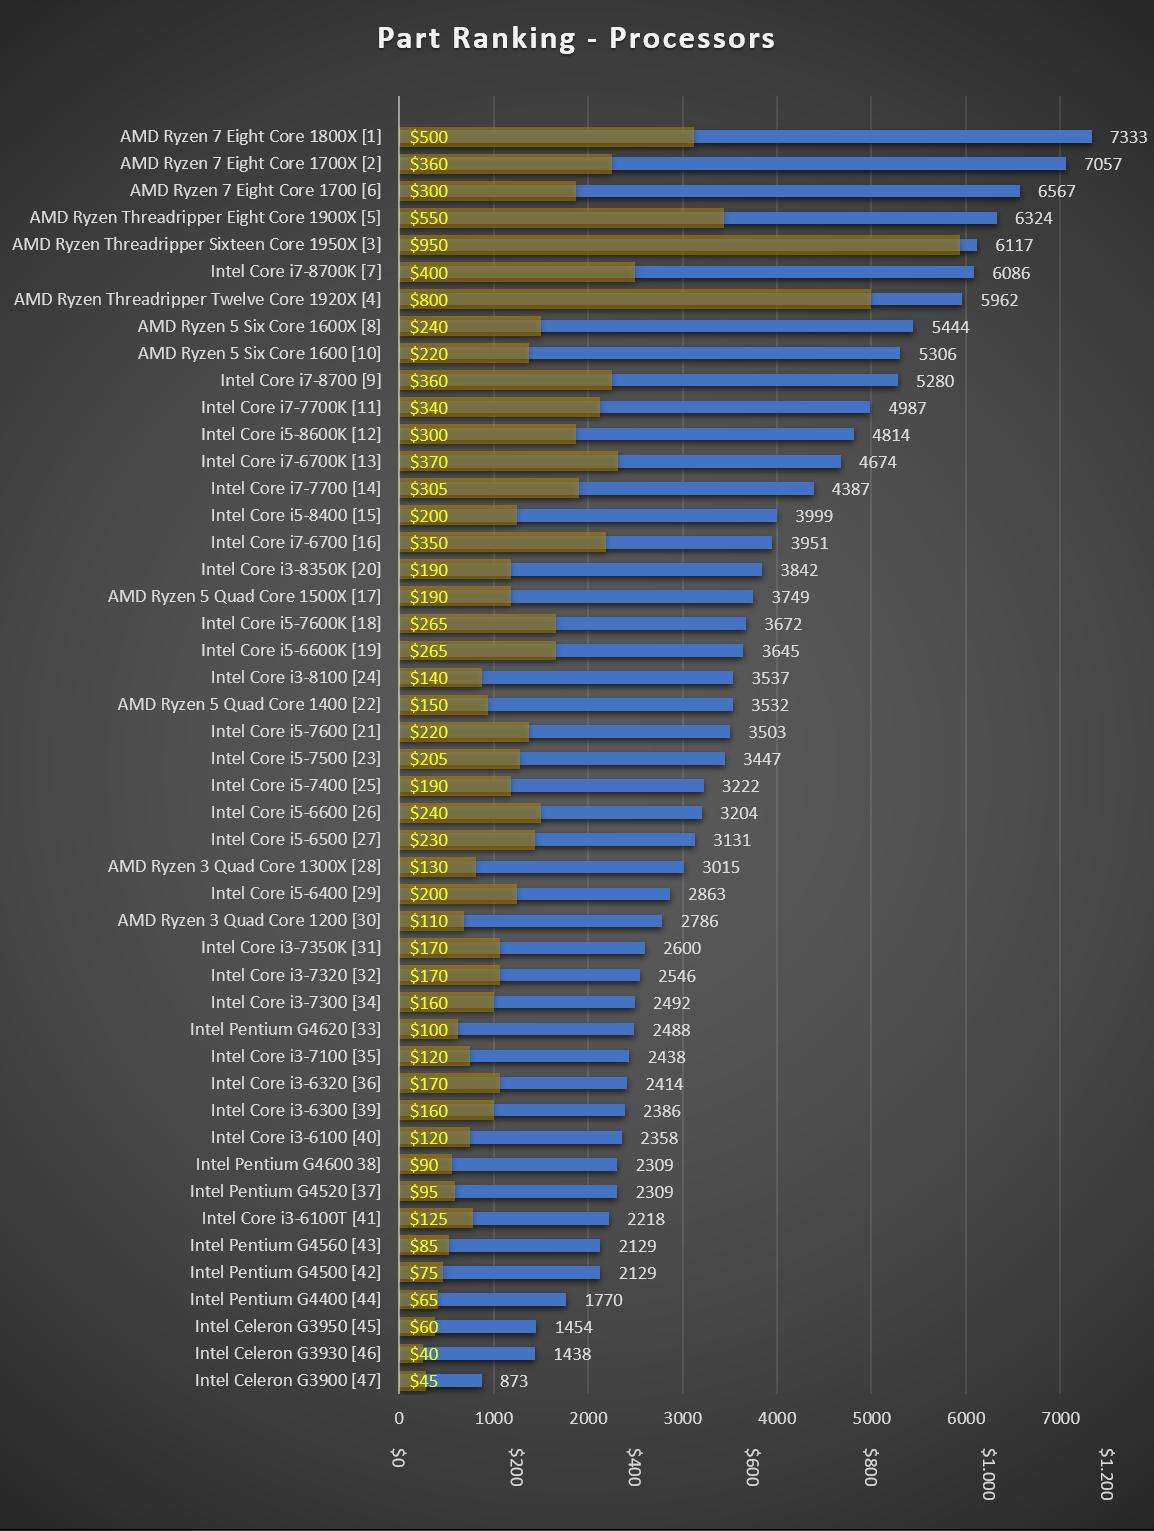
Part Ranking – Processors
- This is the Part Ranking chart for all CPUs.
- The chart here is rearranged according to actual performance numbers.
- This does not take into account RAM configurations. This is only performance values of the CPUs.
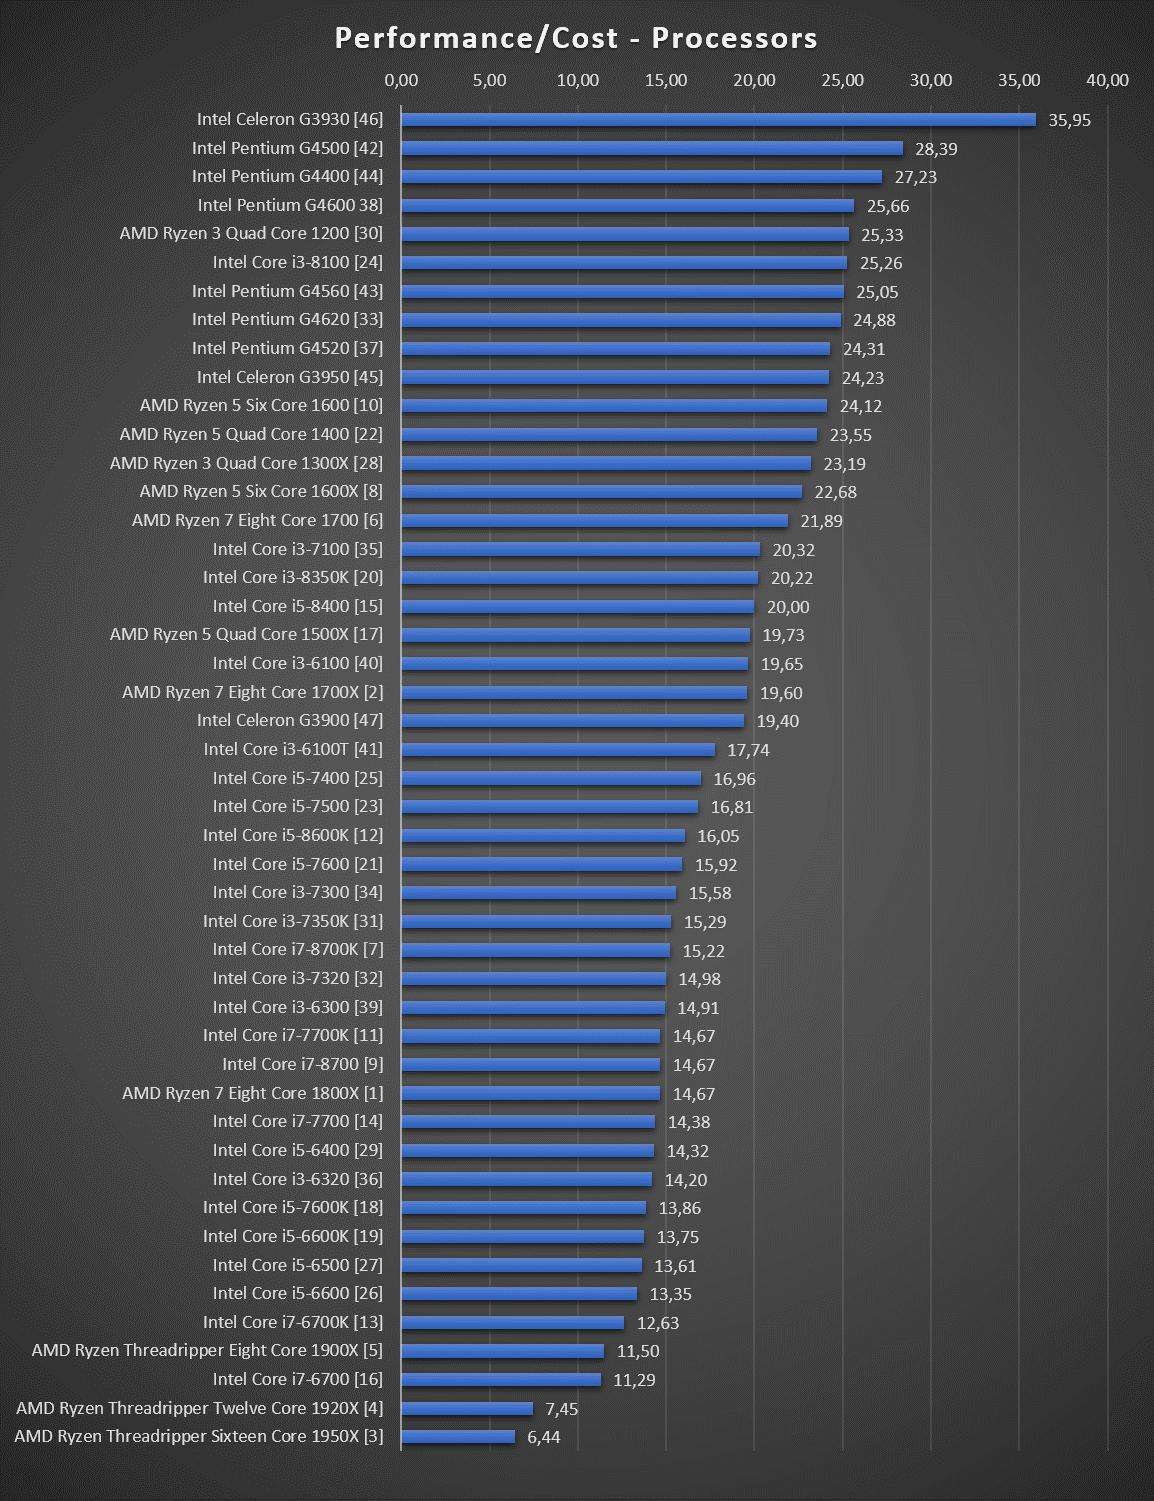
Performance / Cost – Processors
- This is the Performance/Cost chart for all CPUs.
- The chart here is rearranged according to actual performance numbers.
- This does not take into account RAM configurations. This is only performance values of the CPUs.
- The higher the value, the better cost-benefit you’re getting!

Be the first to comment